Showing posts with label Support (Application). Show all posts

Monday, December 26, 2022

Improve New Feature Delivery Rate with Value Stream Mapping

 I constantly see a desire to deliver enhancements and additional business capabilities to end users at a faster rate. What I don't see is a methodical and data-driven approach to achieving a faster delivery rate. I typically use a tactic called value stream mapping to improve clients' speed to market. That tactic seems obvious to me but isn't used as widely as I think it should be.

I'm going to define and illustrate value stream mapping for you in hopes that you see the value and understand the tactic well enough to apply it to your existing production processes and procedures. The concept applies to application features, infrastructure features, DevOps automation capabilities, and just about any type of information technology process I can think of. In fact, it applies to any business process I can think of, including those that aren't IT-related.

Example Application Delivery Value Stream

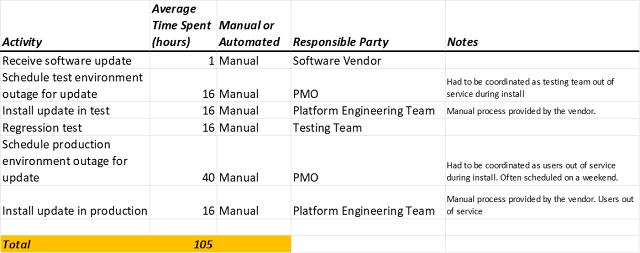
This is an example of the delivery process of a highly customized purchased application (COTS). As customizations were delivered by the vendor quite frequently, updates needed to be tested and deployed quite frequently. On average, the vendor supplied one to two updates per week. Each update required significant manual labor to test and deploy. The time and effort involved were costly and required tuning. We elected to do a value stream analysis. 

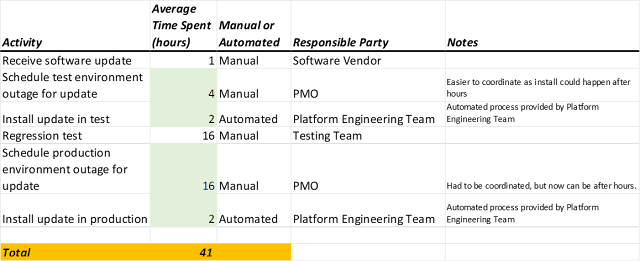
Below are components of the value stream, along with how long manual time was spent testing and deploying them. Note that given the length of outage required for deployments, significant coordination with the testing team and business users was necessary and often extended the lag between updates received from the vendor and getting those updates into the hands of end-users. 


We decided to automate the deployment process. The procedure given to us by the vendor was entirely manual. While the deployment process was only 32 clock-time hours of the total, decreasing that time to 4 hours allowed much greater flexibility in scheduling updates in the test environment as well as production. Now, updating installations for the test environment could be done off-hours without putting the testing team out of service. Additionally, production updates could be deployed off-hours and no longer require the weekend.


Lessons Learned

Automating testing would be the logical next tuning step. That said, automating tests for a COTS application is easier said than done. This particular application did not lend itself to easy UI testing in an automated fashion. As we didn't have access to product source code, testing service APIs wasn't an option either.

The value stream tuning effort illustrated here works for custom applications just as well as it did for this COTS example. The value stream tactic applies the tuning principle of optimizing the largest targets (those that take the most time) first. This principle is used when we tune CPU or memory consumption in applications. In fact, the principal can be used for non-IT processes as well, like budgets.

Value stream analysis should be an ongoing effort repeated periodically. Over time, your deployment process changes. When that happens, the value stream will also change.

As with other types of tuning efforts, it's important to identify a specific target. Like other tuning efforts, it's always possible to keep improving. Having a target allows you to know when the tuning effort is "done" and effort can be directed elsewhere.

Value stream analysis often reveals business procedures and processes that are not optimal. In another example from the field, I've seen DNS entries and firewall rule entries that are forced by organizational procedures to be manual and take significant amounts of lead time. It's important to track these activities in the value stream process as well. You need accurate information to make effective tuning decisions.

Thanks for taking the time to read my article. I'm always interested in comments and suggestions. 


Sunday, December 18, 2022

The Journey toward Continuous Delivery and Deployment: How to Start

I work with teams who are nowhere close to achieving continuous delivery, let alone continuous deployment.  Those teams are getting further and further behind where teams in other companies are on similar journeys. Often,  they don't have automated testing.  If they do,  often they are unit tests and not integration tests.  Often,  they don't have application infrastructure code and can't easily create additional environments. Often,  they work in long-lived feature branches and have teams working on disparate versions of the code. Consequently, the speed of new feature delivery to end users is abysmal. Hope is not lost.  The journey is difficult but possible.  Here are some initial steps to take. 

Establish a basic integration test suite if you don't already have one.  There is not going to be continuous anything without automated integration testing.  With automated integration testing,  you can have confidence that changes, whether they are big fixes or feature enhancements, don't accidentally introduce new defects. Often legacy code bases aren't written to be easily testable at a unit level. Concentrate on integration testing the application at its consumption points.  For web UIs, that means automated functional testing of the UI or at least the REST web service resources.  For APIs consumed by other applications, it means integration testing the service endpoints.  

Unit testing is always important, and I never discourage it.  Integration testing is more important as it tests end-user functionality,  not just small sections of code. If you have no automated tests,  start with integration testing first.  You can implement unit tests for new features along the way. 

Ideally,  the environment for integration testing should be established by infrastructure code before the tests and eliminated after.  That said,  I'm concentrating on the initial steps in this post and don't want to deviate.

Management support is needed for funding automated testing. That funding is both labor and tooling. Initial setup for automated testing has an upfront cost.  Remember that there is a broad range between 0% and 100% coverage.  The higher the percentage,  the better.  That said,  higher percentages have diminishing returns. Don't let perfection be the enemy of progress. 

Establish a continuous integration pipeline (CI) for the main/master source code branch of you don't already have one.  Continuous integration is a firm requirement to continuous delivery. The CI pipeline should run automatically on check-in of code changes.  Continuous integration identifies defects immediately after changes are checked in by executing all available unit and integration tests. The objective is to identify defects as early in the development process as possible. 

If continuous integration (CI) reveals an error,  fixing the error is the highest priority. Many pundits would say that this type of breakage should result in an "all hands on deck" type of emergency and should enlist all members of the team to fix it. As a practical matter,  the developer who checked in the change that broke CI is usually the best person to fix it.  They know what they did and are closer to the problem. The developer's tech lead can follow up with the developer at some point to identify any additional resources needed to fix the issue.  

Adopt trunk-based development and eliminate long-lived feature branches.  Trunk-based code management is a requirement for continuous anything. Trunk-based development ensures that developers are using the newest and most current code base.  This minimizes the chances of "merge hell" and keeps all team members up to date and working on the current code.

Depending on your CI/CD tooling,  it might be easier to use a short-term feature branch and initiate CI on merge.  These feature branches must be short-lived or you're not really adopting trunk-based development. As long as the short-term branch gets deleted after the merge,  this isn't a bad tactic. 

Only start changes that can be completed in four hours or less.  Two hours is better.  Break the change up into smaller pieces if it's longer than that. This reduces merge issues later.  This also reduces the chance that another team member introduces a conflicting change.  This practice provides an incentive to keep changes small and only make one change at a time.  This is in keeping with the objective of delivering new features to users faster. All good.

Eliminate the practice of reviewing pull requests.  Allow automated testing to catch defects.  If a junior developer checks in code that isn't optimal,  a more senior member of the team can refractor that change later and hopefully take the opportunity to educate the junior team member on the issue.  Either way,  if it didn't break CI, not much damage was done. 

Encouraging automated test coverage will change developer behavior. If developers "know" they will be expected to produce automated tests for changes they make, they will code to make testing easier. It's enlightened self-interest. That also makes the code base cleaner and increases its quality.

Continuous delivery is an ongoing,  neverending process.  The beginning tactics I list here are just a start. 

Saturday, November 16, 2019

Streamlining Tagging in Terraform projects.

Tagging resources in Azure or AWS Terraform projects used to be such a mind-numbing pain before the release of Terraform 0.12. For each resource in a Terraform project, the tag section was very verbose and very repetitive.  Now, with new variable functionality that comes with Terraform 0.12, I've fallen into a much more streamlined way of maintaining tags.

Tagging before Terraform 0.12

Before new features for Terraform 0.12, often a variable file had a large section dedicated to tag values and resources assigned those tags had many lines dedicated to tagging as well. An example of what life used to be like is below.  This ritual was repeated for any other resoruces in the project that needed tags.
resource "aws_instance" "webServer" {
 ami           = "${data.aws_ami.linux_ami.id}"
 instance_type = "t2.micro"
 subnet_id  = "${var.subnet_id}"
 key_name = "${var.key_pair}"

 tags {
   "Name" = "${var.instance_name}"
   "Environment" = "${var.environment}"
   "ChargebackDept" = "${var.chargeback}"
   "Business Priority" = "${var.priority}"
Many more tags indeed ad nauseum!
 }

}

Tagging after Terraform 0.12

I've fallen into the habit of using Terraform's new variable typing construct along with the map variable type and the map and merge functions. Today, my tag references look like the following for all resources that need tags. The important part is yellow.

resource "aws_instance" "webServer" {
 ami           = "${data.aws_ami.linux_ami.id}"
 instance_type = "t2.micro"
 subnet_id  = "${var.subnet_id}"
 key_name = "${var.key_pair}"

 tags {
   tags = "${merge(var.project_tags, var.environment_tags, map("Name", var.instance_name))}"
 }
}

Notice I use the merge function to combine two maps together. The first is project-wide and the second contains environment-related tag names and values. I also use the map function to add an entry for this specific resource.

In a variable file I typically call vars.tf, there are two variables declared. One has project-wide tag entries and another I reserve for environment-related entries.  Here's an example from vars.tf:
variable "project_tags" {
  type          = map
  default = {
    ChargebackDept         = "dan_haberer@vfc.com"
    BusinessPriority          = "VF Services"
 Include any number of tags in a format easy to maintain
  }
}

variable "environment_tags" {
  type          = map

}

Additionally, I typically use a tfvars file for environment-related tags.  Here's an example:
environment_tags = {
    Environment = "Development"

}

Looking at the Pros and Cons

I like this approach over the previous approach for several reasons.

Tag names and values are easy to maintain. Most tag names and values are in one spot. 

There are not as many variables to declare. While the variables contain larger values in the form of maps, I don't need to handle nearly as many of them in my Terraform projects.

This solution is much less verbose. I've cut hundreds of lines from some of my Terraform projects with this trick alone.

I hope you find this trick useful. I'm always open to ways to streamline Terraform code even further.


Sunday, December 11, 2016

Automated Integration Testing in a Microservices World.

Everyone's dabbling with microservices these days. It turns out that writing distributed applications are difficult. They offer advantages to be sure. However, there is no free lunch. One of the difficulties is automated integration testing. That is, testing a microservice with all the external resources it needs including any other services it calls, the databases it uses, any queues it uses. Just setting up and maintaining these resources can be a daunting task that often takes specialized labor.  All too often, integration testing is difficult enough that the task is sloughed off. Fortunately, Docker and it's companion product Docker Compose can make integration testing much easier.

Standardizing on Docker images for deployment artifacts makes integration testing easier. Most organizations writing microservices seem to adopt Docker as a deployment artifact anyway as it greatly speeds up interaction between application developers and operations. It facilitates integration testing as well as you can deploy services you consume (or mocks for the services you consume) temporarily and run integration tests against them. Additionally, consumers for your service can temporarily deploy your docker image to perform their own integration tests. However, as most services also need databases, message queues, and possibly other resources to function properly, that isn't the end of the story. I've previously written about how to dockerize (is that a word?) your own services and applications here.

Docker images already exist for most database software and message software. It's possible to leverage these docker deployments for your own integration testing. In other words, the community has done part of your setup work for you. For example, if my service needs a PostgreSQL database to function, I leverage the official Docker deployment for my integration tests. As it turns out, the Postgres docker deployment makes their image very easy to consumer for integration testing. All I need to do is mount the directory '/docker-entrypoint-initdb.d' and make sure that directory has any SQL files and/or shell scripts I need run to set the database up for use by my application.  The MySQL docker deployment does something similar. For messaging, similar docker distributions exist for RabbitMQ, Active MQ, and Kafka. Note that ActiveMQ and Kafka aren't yet "official" docker deployments.

Docker Compose makes it very easy to assemble multiple images into a consistent and easily deployable environment. Docker-compose configurations are YAML files. Detailed documentation can be found here. It is out of scope for this blog entry to do a complete overview of Docker Compose, but I'll point you to an open source example and discuss a couple of snippets from the example as an illustration.

The screen shot on the left contains a snippet of a docker-compose configuration. The full source is here. Note that each section under services describes a docker image that's to be deployed and possibly built. In this snippet, images vote, redis, worker, and db are to be deployed. Note that vote and worker will be built (e.g. turned into a Docker image) before they are deployed. For images already built, it's only necessary to list the image name.

Other common compose directives are as follows:
  • volumes-- links a directory in the real world to a directory inside the container
  • ports-- links a port in the real world to a port on the inside of the container. For example, vote links port 5000 on the outside to port 80 on the inside.
  • command-- specifies the command within the Docker container that will be run at startup.
  • environment-- (not illustrated here) allows you to set environment variables within the Docker container


Assemble and maintain a Docker compose configuration for your services. This is for your own use in integration tests and so that your consumers can easily know what resources you require in case they want to run integration tests of their own. It's also possible for them to use that compose configuration directly and include it when they set up for their own integration tests.

The Docker environment for your integration tests should be started and shut down as part of the execution of the test. This has many advantages over maintaining the environment separately in an "always on" state. When integration tests aren't needed, they son't consume resources regardless. Those integration tests, along with their environment, can be easily run by developers locally if they need to debug issues; debugging separate environments is always more problematic. Furthermore, integration tests can be easily and painlessly be hosted anywhere (e.g. on-premise, in the cloud) and are host agnostic.

An Integration Test Example

I would be remiss if I didn't pull these concepts together for an integration test example for you.  For my example, I'm leveraging an integration test generic health check written to make sure that a RabbitMQ environment is up and functioning. The source for the check is here, but we're more interested in its integration test today. 

This test utilizes the DockerProcessAPI toolset as I don't currently work in environments that require a docker-machine and the Docker Remote API (Linux or Windows 10 Pro/Enterprise). If your environment requires a docker-machine (e.g. it is a Mac or an earlier version of Windows), then I recommend the Spotify docker-client instead.

The integration test for the health check uses Docker to establish a RabbitMQ environment before the test and shut it down after the test. This part is written as a JUnit test using the @BeforeClass and @AfterClass annotations to bring the environment up once for the entire test and not for each test individually.
In this example, I first pull the latest RabbitMQ image (official distribution). I then map a port for RabbitMQ to use and start the container. I wait five seconds for the environment to initialize, then cause a logging for the current docker environment running.

My log of what Docker containers are running isn't technically required. It does help sometimes if there are port conflicts where the test is running or other problems with a failed test that need to be investigated. As this test runs in a scheduled manner, I don't always know execution context.

After the test completes, the @AfterClass method will shut down the RabbitMQ instance I started and once again cause a container listing just in case something needs to be investigated.

That's a very short example. Had the integration test environment been more complicated and I needed Docker Compose, that would have been relatively simple with the DockerProcessAPI as well. Here's an example of bringing up a Docker Compose environment given a compose configuration YAML:

Here's an example after the test of bringing that same environment back down:

In addition, there are additional convenience methods on the DockerProcessAPI that can log compose environments that are running for investigative purposes later.

Thanks for taking time to read this entry. Feel free to comment or contact me if you have questions.  

Resources


Friday, September 23, 2016

Using Java Thread Dumps to Diagnose Application Performance

On a holiday weekend last year, I got an emergency call from a client. One of their Java EE applications would freeze and stop servicing users within an hour after container start-up. I was called in to help investigate. I started off by requesting a thread dump and memory dump of the container once it had stopped accepting requests. It's the thread dump that I'm focusing on today.  That Java thread-dump is here (package scrubbed to protect the client).

During that exercise, I noticed that when I analyze thread dumps, I look for the same things. Whether it's a performance issue or some sort of freezing issue, I manually scanned the thread dump for the same types of conditions. This year, working for another client, I'm faced with a performance tuning exercise that will likely require analysis of numerous thread dumps and wasn't looking forward to the busy work. That prospect got me to do some introspection and figure out exactly what I look for and find or build a product that does this.

Threads that block other threads

Most developers know the syntax behind using Java's synchronized keyword and that it's used to ensure that one and only one thread executes a section of code or uses a given Java resource at one time. I'm not going to digress into a discussion of lock monitors and coding issues; if you need a refresher, please see this article. Most experienced developers use synchronization with extreme care as bugs with synchronization are intermittent and extremely hard to diagnose and fix.

Frequent symptoms of synchronization issues are performance problems or cases where applications freeze and no longer accept client requests. Essentially, synchronization causes other threads servicing other client requests to wait until the needed Java resource is available for use. Those waiting client threads are typically in a BLOCKED state. I immediately suspected this type of issue in diagnosing the issue I was investigating over the holiday last weekend.  Here's a sample of a BLOCKED thread entry in a thread dump:

"http-bio-10.13.0.222-30105-exec-427" daemon prio=6 tid=0x000000001cf24000 nid=0x2054 waiting for monitor entry [0x0000000022f9c000]
   java.lang.Thread.State: BLOCKED (on object monitor)
 at java.beans.Introspector.getBeanInfo(Introspector.java:160)
 - waiting to lock <0x0000000680440048> (a com.sun.beans.WeakCache)
 at org.apache.axis.utils.BeanUtils$1.run(BeanUtils.java:92)
 at java.security.AccessController.doPrivileged(Native Method)

Note that the dump explicitly lists that it's waiting on resource 0x0000000680440048 which is owned by this thread:

"http-bio-10.13.0.222-30105-exec-289" daemon prio=6 tid=0x000000001bf06000 nid=0x21b0 runnable [0x000000002e0dd000]
   java.lang.Thread.State: RUNNABLE
 at java.lang.Class.getDeclaredMethods0(Native Method)
 at java.lang.Class.privateGetDeclaredMethods(Class.java:2521)
 at java.lang.Class.privateGetPublicMethods(Class.java:2641)
 at java.lang.Class.getMethods(Class.java:1457)
 at java.beans.Introspector.getPublicDeclaredMethods(Introspector.java:1280)
 - locked <0x0000000680440048> (a com.sun.beans.WeakCache)
 at java.beans.Introspector.internalFindMethod(Introspector.java:1309)

It turns out that more than one thread was waiting on this resource.

IO bound threads

One frequent source of application performance issues are threads that are waiting on Input/Output to occur. This often takes the form of a database read or write or a service call of some type.  Many developers assume that most performance issues are caused by slow database access and start looking at SQL queries. I do not make this assumption. Furthermore, if it is a database tuning issue, you need to identify the specific SQL that needs to be tuned. At any rate, if the source of your performance issue is IO, thread dumps can help you identify where in your code the issue is taking place. 

Here is an example thread that's IO-bound:

"QuartzScheduler_Worker-2" prio=6 tid=0x000000001abc7000 nid=0x2208 runnable [0x000000001df3e000]
   java.lang.Thread.State: RUNNABLE
 at java.net.SocketInputStream.socketRead0(Native Method)
 at java.net.SocketInputStream.read(SocketInputStream.java:152)
 at java.net.SocketInputStream.read(SocketInputStream.java:122)
 at java.io.DataInputStream.readFully(DataInputStream.java:195)
 at java.io.DataInputStream.readFully(DataInputStream.java:169)
 at net.sourceforge.jtds.jdbc.SharedSocket.readPacket(SharedSocket.java:850)
 at net.sourceforge.jtds.jdbc.SharedSocket.getNetPacket(SharedSocket.java:731)
... (many thread stack entries omitted for brevity)
        at com.jmu.scholar.dao.FormRuleDAO.findByFormId(FormRuleDAO.java:50)

Note that within the thread stack, there's an explicit reference to application code that's initiating the IO. In this case, IO is being initiate by a database query in a specific application method. 

Note that just because the dump caught this one occurrence of this query, doesn't mean it's a performance issue. If, however, a large percentage of running threads are IO-bound in the same method, then this database access would become a tuning target. To tune this specific database access, a developer can focus on this one query instead of looking at all queries within the application. How to tun the database access is out of scope for this blog entry.

Performance Hot Spots

Most developers upon being asked how to tune an application in an interview will tell you to use a Java profiler. That answer misses the point. A profiler helps you tune a specific section of code after you've identified the section of code that needs to be tuned. Often performance issues show up in production and it's not possible to run a profiler on your container in production. 

A thread dump taken in production on an active application can help you identify which section of code needs to be tuned, perhaps with a profiler. Furthermore, thread dumps are unintrusive enough that you can take them in production without material impact to users.  

To see how dumps help, let's review how a profiler works. A profiler works by taking a thread dump periodically, perhaps every 5 milliseconds. That thread dump specifies where in your code you're spending time. For example, if your test causes the profiler to take 100 samples and method Work.do() appears in 33 of them, then your spending 33% of your time in that method. If that's the method with the highest percentage, that is where you'll often start tuning.

In fact, thread dump data is better than profiler data in several ways:
  • It measures what's actually happening in production vs. a profile of a specific business process or unit test case.
  • It includes any synchronization issues between threads that won't show up in a profile of one thread in a unit test case (there are no other threads to contend with).

The problem is collecting the data. Yes, thread dumps are easy to collect. Counting occurrences of method references in running threads is laborious, tedious, and annoyingly time consuming.

Introducing StackWise

The first thing I did was scan for products that analyze thread dumps for these types of issues. There are many products that analyze thread dumps, but they tend to be interactive tools that summarize threads and allow you to selectively expand and contract them. A couple categorized threads by state (e.g. RUNNING, BLOCKED, etc.). However, none of these really looked for the three items I look for. Hence, I created the product StackWise, which is open source and freely available for you to use.

StackWise will analyze a thread dump and report useful information on all three of these conditions.  A sample of StackWise output can be found here.  Note that you get the following items of information:
  • The percentage of threads that are IO bound and a summary of those IO-bound threads.
  • Threads that are locking resources needed by other threads.
  • A list of application method reference counts listed in descending order. 
In interpreting performance hot spots, StackWise will report application methods in which you're spending the most time. Methods belonging to ServletFilter classes can be ignored as they are often listed in all running threads.  Other method mentions, however, are possible tuning targets.

If you analyze thread dumps in ways other than what StackWise already covers, I'd like to hear your ideas.  Thanks for reading this entry.
Monday, January 2, 2012

With Java: 'private' does not mean private.

It turns out, you can get access to fields and methods in JDK classes declared as 'private' through reflection.  I don't recommend this and prefer not to use what I'm about to describe.  In fact, I consider what I'm about to describe as an option of last resort.

Recently, I ran into bug 6526376 which describes a memory leak in the JDK that impacts products that use java.io.File.deleteOnExit().  This method tracks the file that will be deleted in a statically defined Set in class java.io.DeleteOnExitHook.  This set grows, but never shrinks during the life of the JVM, creating a memory leak. 

While this bug is marked as fixed in the latest release of the JDK, upgrading to the latest release wasn't an option.  Furthermore, this Set is defined as 'private' with no way to get access to its contents and clear the Set (after doing its work), or so I thought.  Upon reading a post from Cedriks weblog, I realized that there was a way to access the files listed in this private Set and perform its work through a batch job.

The secret ingredient for this solution is the following four lines:

Class<?> exitHookClass = Class.forName("java.io.DeleteOnExitHook");
Field privateField = exitHookClass.getDeclaredField("files");
privateField.setAccessible(true);
LinkedHashSet<String> fileSet = (LinkedHashSet<String>) privateField.get(null);
// You then have full access to the privately defined Set and can modify its content.


With this particular solution, you do want to take care to synchronize access to the Set and not to delete files that are currently in use.  I haven't tried this trick to execute private methods yet, but I see no reason why it wouldn't work.  Furthermore, these four lines could easily be abstracted and consolidated into a utility class somewhere and re-used in other situations.

I've mixed feelings about this solution.  I'm glad that I was able to work around the memory leak with a short amount of code. We would have been stuck recycling our containers periodically, otherwise.  I've run into bugs with open source products where this solution could conceivably be used as well.

On the other hand, this breaks encapsulation and leaves developers no way to really guard against unauthorized access to private fields and methods.  An architecture principle I try to follow is 'Swim with the stream'.  That is, use products as they are intended to be used.  This hack definitely breaks this principle.  Should we really be able to do this?

There is no question that this is a dangerous tactic.  Private methods and fields are effectively unpublished from the perspective of the developers who wrote the code in question.  Those developers, can and should feel completely free to refactor (e.g. change or even remove) those private methods and fields with the understanding that they aren't directly affecting calling code.  These private fields/methods may disappear in future releases of the code being accessed this way or their intended use may be drastically changed.  My solution is fragile and will likely break with a future release of the JDK.

It's possible that developers using this tactic to break into sections of code they weren't given access to might not understand the full context of the fields and methods being used; there may be unintended runtime consequences to accessing and changing private data that hasn't been considered.  In my case, how can I really tell if a File listed in the shutdown hook isn't still being used?  I elected to address this issue by not deleting any file until an hour after last update or later, but this isn't fool-proof.  It's possible that by deleting these files early and removing the set entry, I've created a derivative bug somewhere that will likely be much harder now to find and fix.

On further consideration, the creators of the JDK were wise to allow this.  It gives us options when dealing with bugs like this.  If I've a developer on staff that routinely uses fragile solutions like this, I've got larger issues.  Changing the JDK to prevent this type of unauthorized access to private fields/methods won't save me from the other damage a developer like that can cause.